The global online poker market in 2024–2026 is valued by leading consulting and research agencies at $4.78 billion, with projections forecasting expansion to $10.5 billion by 2034 (representing a compound annual growth rate of 8–9%). Yet behind the buoyant top-line financial reports published by gaming operators lies the most severe technological, structural, and regulatory crossroads in the industry’s 25-year history.
The defining paradox of modern poker is that while gross revenue metrics climb on the back of mobile club applications, Asian-Latin American market penetration, and record-smashing live tournament guarantees, classic online poker as a frictionless livelihood for independent grinders has largely vanished. The profession has been squeezed under a triple threat: pervasive artificial intelligence adoption (GTO solvers and Real-Time Assistance), escalating effective rake burdens, and the aggressive balkanization of national player pools.
- Market Valuation: $4.78 billion currently, projected to touch $10.5 billion by 2034.
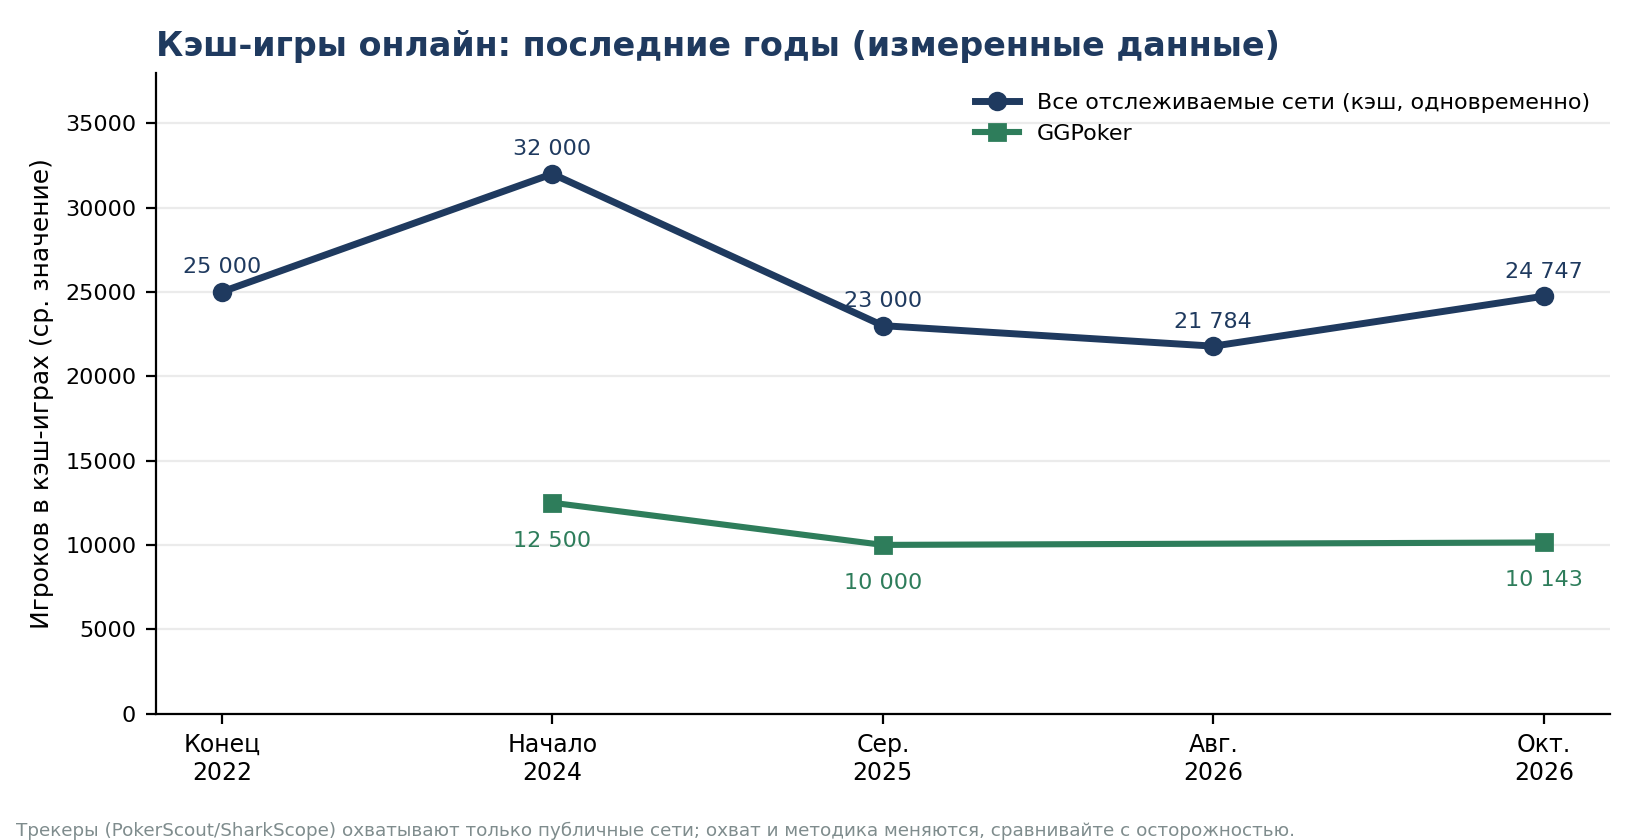
- Current Cash Game Traffic (October 2026): Approximately 24,700 concurrent cash players across publicly monitored networks; GGPoker commands over 41% of global liquidity (10,143 peak concurrent seats).
- Changing of the Guard: In July 2026, crypto-native operator CoinPoker (2,032 concurrents) officially overtook heritage titan PokerStars (1,926 concurrents).
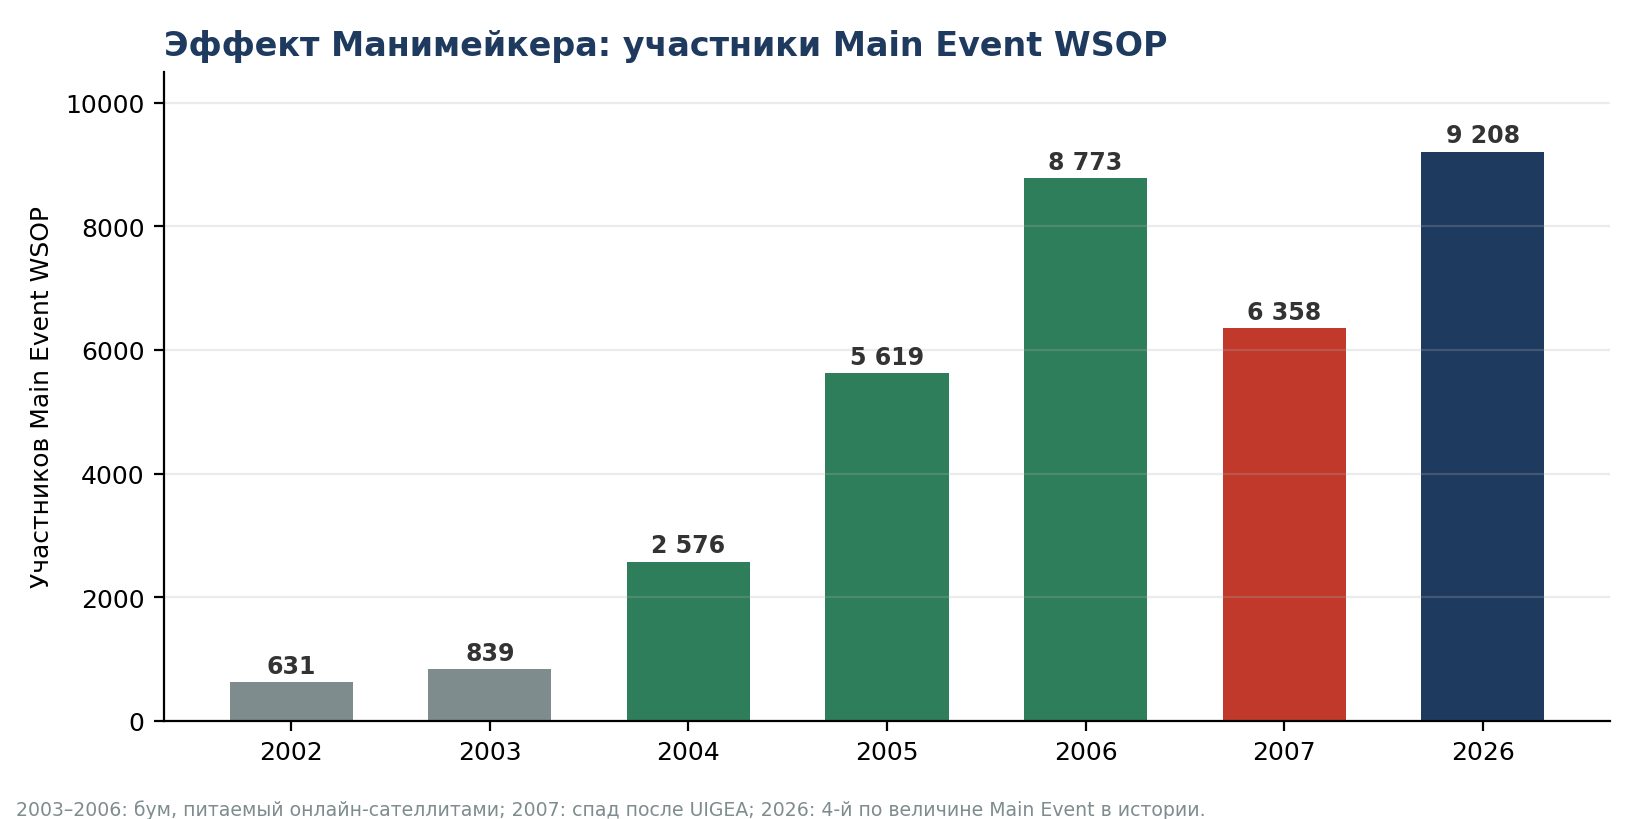
- Tournament Boom: While cash games contract, tournament ecosystems continue to shatter attendance records. The 2026 WSOP logged 251,901 entries, with the Main Event drawing 9,208 players (the 4th largest in poker history).
- Surviving Professionals: An estimated 25,000 to 35,000 individuals worldwide currently earn their primary living exclusively through online poker (down from over 100,000 during the 2010 peak). Career professionals now represent under 1.5% of the total pool.
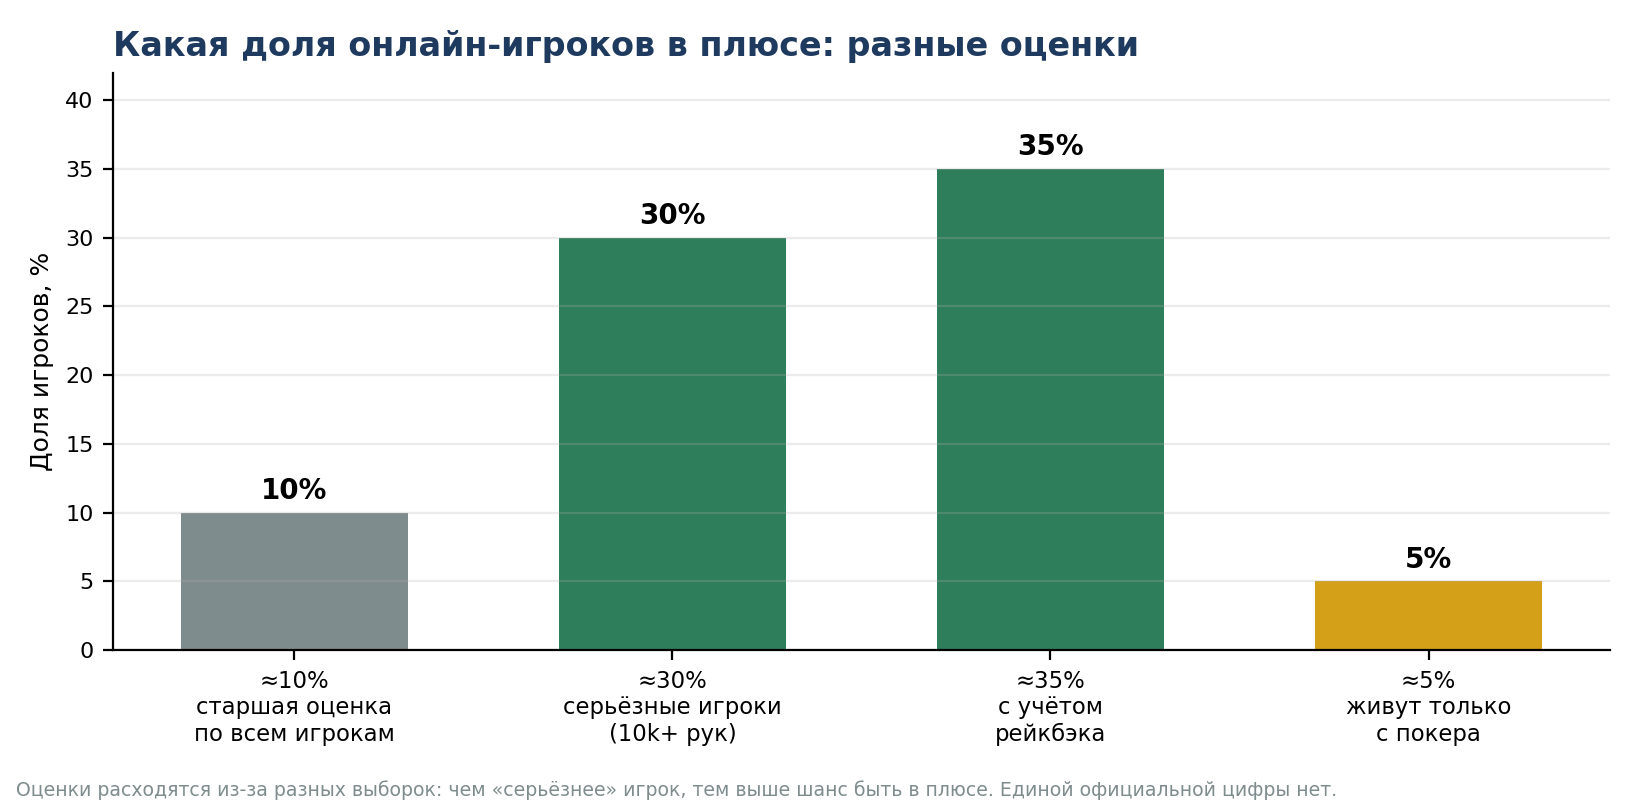
- Winning Players: Only 6% to 9% of regular players finish net positive over significant sample sizes after rake deduction; fewer than 1.5–2% clear over $2,000–$3,000 monthly.
- AI Disruption: Solvers have pushed baseline technical proficiency to near-perfection. RTA tools with sub-second response times present an existential integrity crisis, forcing operators into biometric telemetry tracking and game-theory equilibrium audits.
1. Traffic Evolution: The Five Eras of Online Poker (2000–2026)
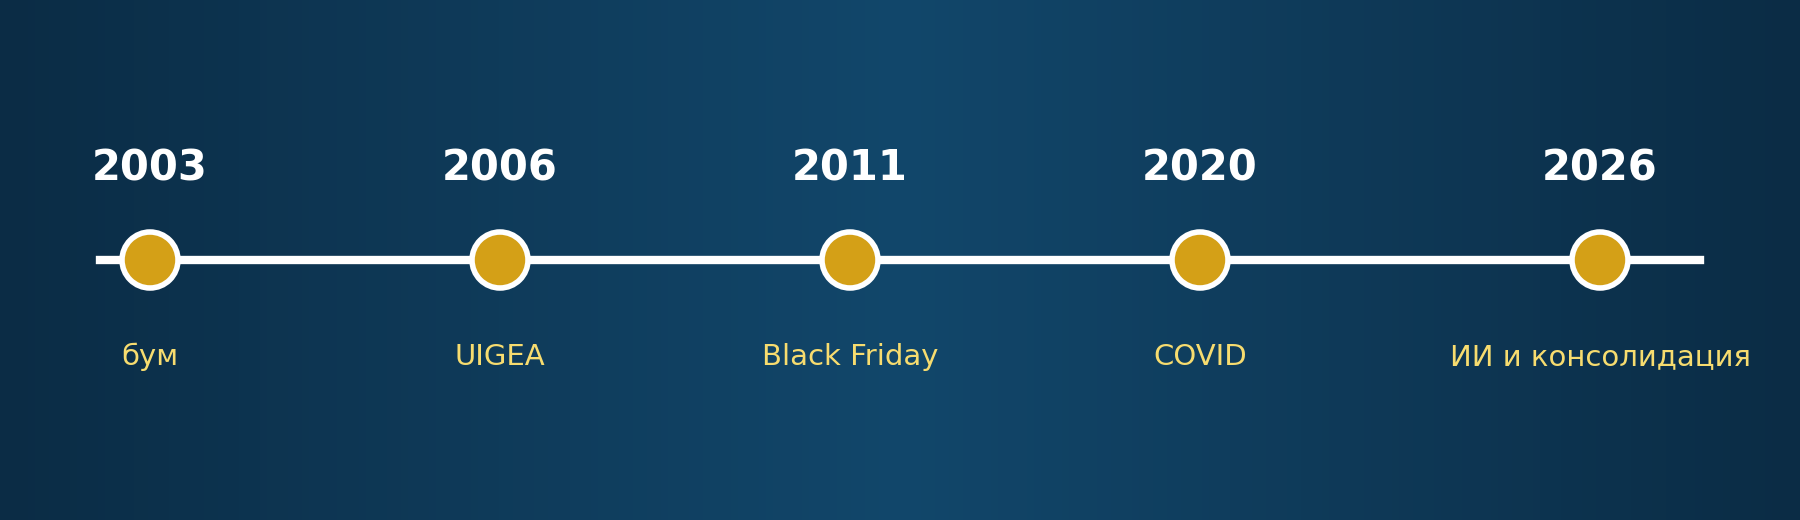
The historical trajectory of online poker cash traffic is a dramatic sine wave shaped by five distinct developmental eras:
The Five Eras of Online Poker
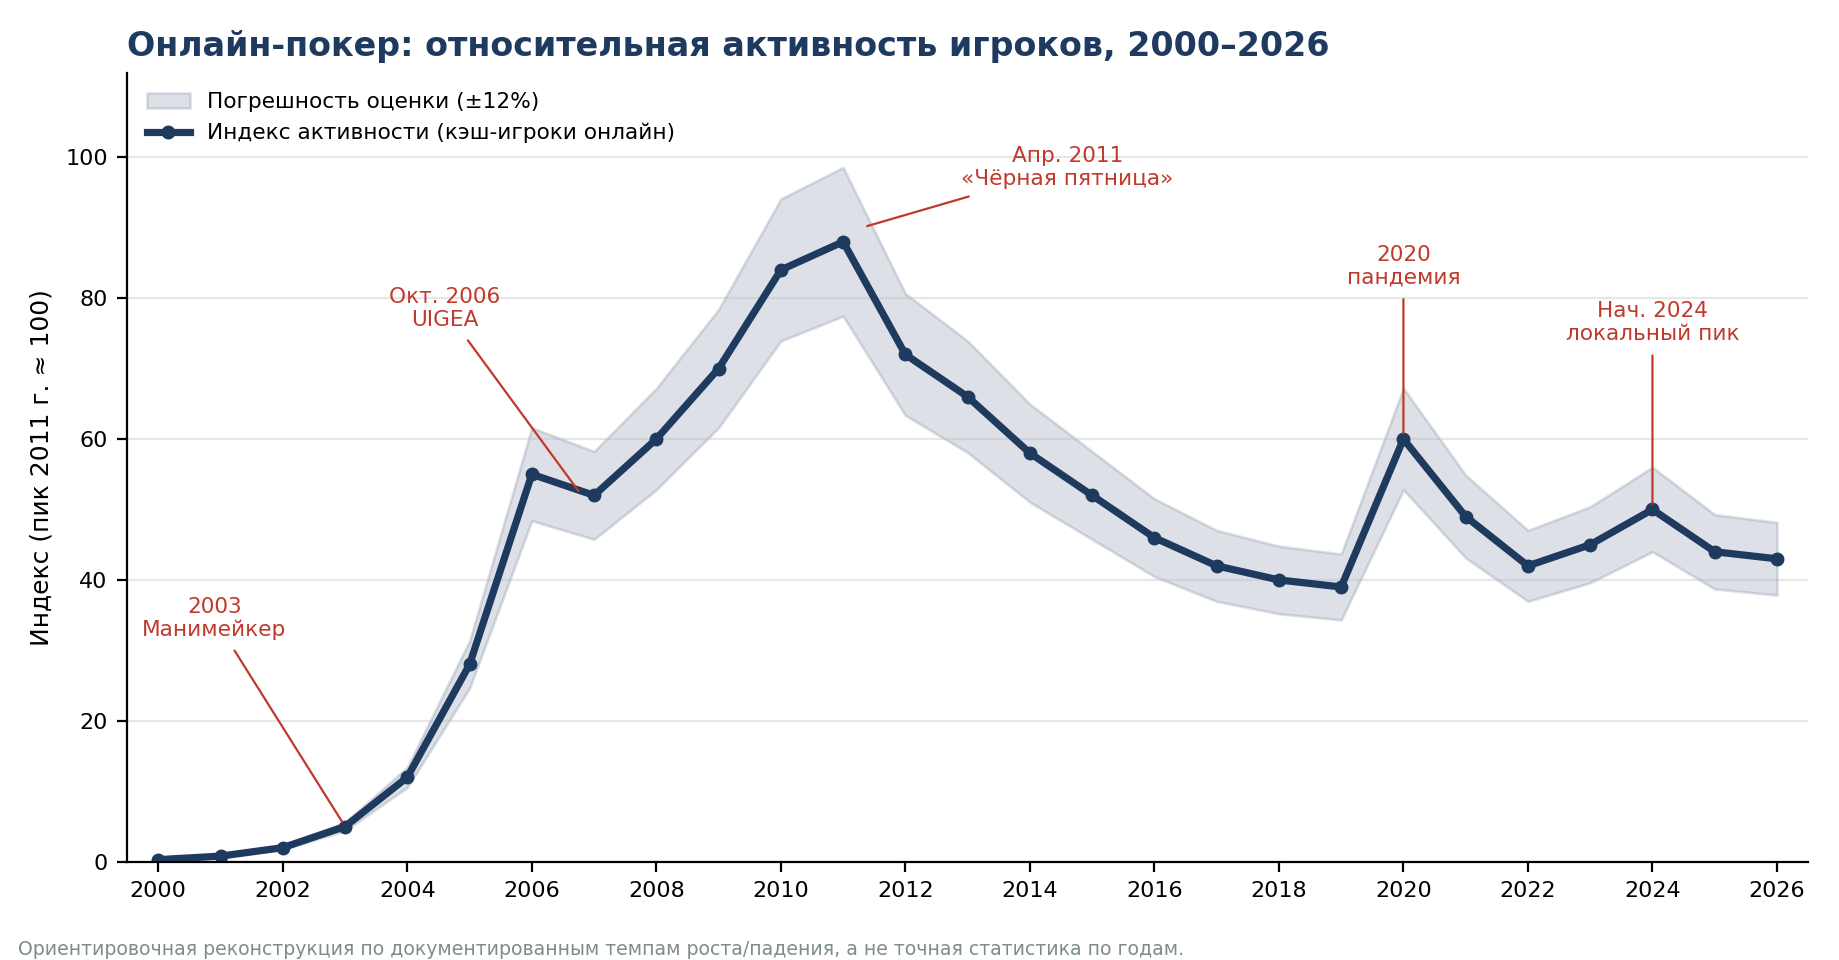
- Genesis and the "Moneymaker Effect" (2000–2005): In 2000, aggregate concurrent cash traffic worldwide barely topped 5,000 players. The catalyst arrived in 2003 when amateur accountant Chris Moneymaker parlayed an $86 online satellite ticket into $2.5 million and the WSOP Main Event championship. This catalyzed a worldwide poker explosion, doubling online player pools annually.
- The Golden Age (2006–2010): Despite the enactment of the Unlawful Internet Gambling Enforcement Act (UIGEA) in the United States in October 2006—which drove PartyPoker out of the US—global liquidity accelerated exponentially through PokerStars and Full Tilt Poker. Peak liquidity was reached around 2010–2011, with 24-hour average concurrent cash volume hitting 160,000 to 180,000 active seats.
- "Black Friday" and Sustained Contraction (2011–2019): On April 15, 2011, the US Department of Justice seized leading domain names and froze player bankrolls. Global traffic cratered by 20–35% overnight. The ensuing eight years saw prolonged contraction fueled by European ring-fencing (segregated national pools in France, Spain, and Italy) and systemic loyalty program rollbacks.
- The Pandemic Surge (2020–2021): Global lockdown mandates in spring 2020 triggered an influx of recreational and legacy players, temporarily restoring traffic to 2012 benchmarks. Analysts accurately identified this surge as a temporary bubble, which largely deflated by autumn 2021.
- The Era of GGPoker, Club Apps, and AI (2022–2026): Market hierarchy underwent total reorganization. GGPoker dethroned PokerStars to become the undisputed global liquidity hub. Simultaneously, high-stakes and mid-stakes cash games migrated to private mobile club platforms (ClubGG, PokerBros, PPPoker) managed via agent networks.
Timeline and Major Traffic Benchmarks
| Period | Key Events and Traffic Dynamics |
|---|---|
| 2003–2006 | Player liquidity doubled annually. WSOP Main Event participation surged from 839 entrants (2003) to 8,773 (2006). |
| October 2006 | UIGEA passes in the US. PartyPoker exits the US market; WSOP 2007 attendance slips by 28%, but international liquidity resumes >10% annual growth. |
| Early 2011 | All-time peak in global cash traffic driven by European expansion, PokerStars dominance, and Full Tilt marketing. |
| April 15, 2011 | "Black Friday": US authorities seize domains of top operators. Traffic drops 20% instantaneously, followed by an average ~14% annual decline over 3 years. |
| 2015–2016 | PokerStars cash traffic declines from ≈19,000 to ≈11,500 concurrents (a 9-year low), coinciding with the elimination of the Supernova Elite status and rake restructuring. |
| 2020 | Pandemic traffic spike: Worldwide lockdowns spark an unprecedented short-term gaming surge before correcting to pre-COVID levels by late 2021. |
| 2022–2026 | Cash traffic stabilizes within a narrower band: ≈25,000 concurrents in late 2022, peaking near 32,000 in early 2024, and consolidating around 22,000–25,000 by mid-2026. |
2. Current Market Landscape (October 2026): Consolidation, Crypto, and Balkanization
The state of online poker in late 2026 is governed by four transformative dynamics:
- Severe Liquidity Concentration: The top five networks control roughly 70% of global cash game liquidity. GGPoker reigns supreme with 10,143 average concurrent cash players (41.0% market share). The open international dot-com pool accounts for 63.9% of all monitored players (15,815 out of 24,747).
- Ascent of Crypto-Rooms and Legacy Retreat: In July 2026, crypto-first room CoinPoker (2,032 concurrents) officially eclipsed former market hegemon PokerStars (1,926 concurrents). Over a 90-day window, CoinPoker grew liquidity by 22.7%, while PokerStars shed 15.0% of its cash audience. Frictionless cryptocurrency cashier transactions, lack of bureaucratic KYC delays, and transparent rake rewards fueled this shift.
- Stagnation in Regulated US and European Geographies: The legal, regulated multi-state US online poker market accounts for just 808 concurrent cash players—a meager 2.4% of global liquidity. In April 2026, the standalone PokerStars brand was retired in the US, transitioning into the FanDuel gaming suite. Meanwhile, grey-market US sweepstakes poker platforms contracted to 501 concurrents under intensifying state regulatory scrutiny.
- Geographic Exits and Regulatory Enclosures: Throughout 2025–2026, major dot-com operators exited Poland, Latvia, Japan, and Sri Lanka (shaving an estimated 7% off open liquidity). India enacted sweeping federal prohibitions on real-money gaming, severing one of the fastest-growing recreational player bases.
- The Tournament Boom Versus Cash Drought: While cash games contract due to elevated skill floors, multi-table tournaments (MTTs) are thriving. GGPoker registers approximately 576,000 tournament entries daily, while France-based Winamax logs 384,000. The 2026 WSOP awarded 100 gold bracelets across 251,901 entries.
3. Professional Population and True Player Winrates
During the 2004–2006 boom, turning a steady $2,000 to $5,000 monthly profit required little more than memorizing David Sklansky's fundamental preflop charts, table selecting recreationals, and avoiding acute tilt. Today, breaking into professional poker requires rigorous technical discipline comparable to quantitative financial analysis.
Cross-referencing database telemetry from tracking utilities (Hold'em Manager, PokerTracker, Hand2Note) and operator liquidity audits highlights how the player distribution has evolved over two decades:
| Category | 2003–2007 (Boom Era) | 2014–2018 (HUD Era) | 2025–2026 (Solver & AI Era) |
|---|---|---|---|
| Net Winning Players (Post-Rake) | 25% – 30% | 12% – 15% | 6% – 9% |
| Breakeven Players (Rakeback Grinders) | ≈15% | ≈15% | 10% – 12% |
| Net Losing Players (Recreational / Casual) | 55% – 60% | 70% – 73% | 80% – 84% |
| Full-Time Professionals (Sole Income) | ≈5% – 7% of pool | ≈2% – 3% of pool | Under 1.5% of pool |
How Many True Professionals Remain?
Conservative industry estimates place the total global population of full-time online poker professionals between 25,000 and 35,000 individuals. At the zenith of the poker boom around 2010, that figure exceeded 100,000 active players.
Rake: The Hidden Winrate Destroyer
Why are so few players genuinely profitable? Over large samples, the primary obstacle facing an aspiring pro is not opponent superior skill, but operator rake (table commission). Across micro- and low-stakes games (NL2 through NL50), rake siphons anywhere from 5 to 10 bb/100 (big blinds per 100 hands dealt).
Before table fees, approximately 25–30% of active players hold a technical edge over their table average. However, once the rake is deducted, the vast majority of marginally skilled players are forced into breakeven or losing territory. In raw economic terms, fewer than 1.5% to 2% of the most disciplined practitioners maintain monthly earnings exceeding $2,000 to $3,000.
4. Earnings Anatomy: Winrates and Daily Realities of Modern Pros
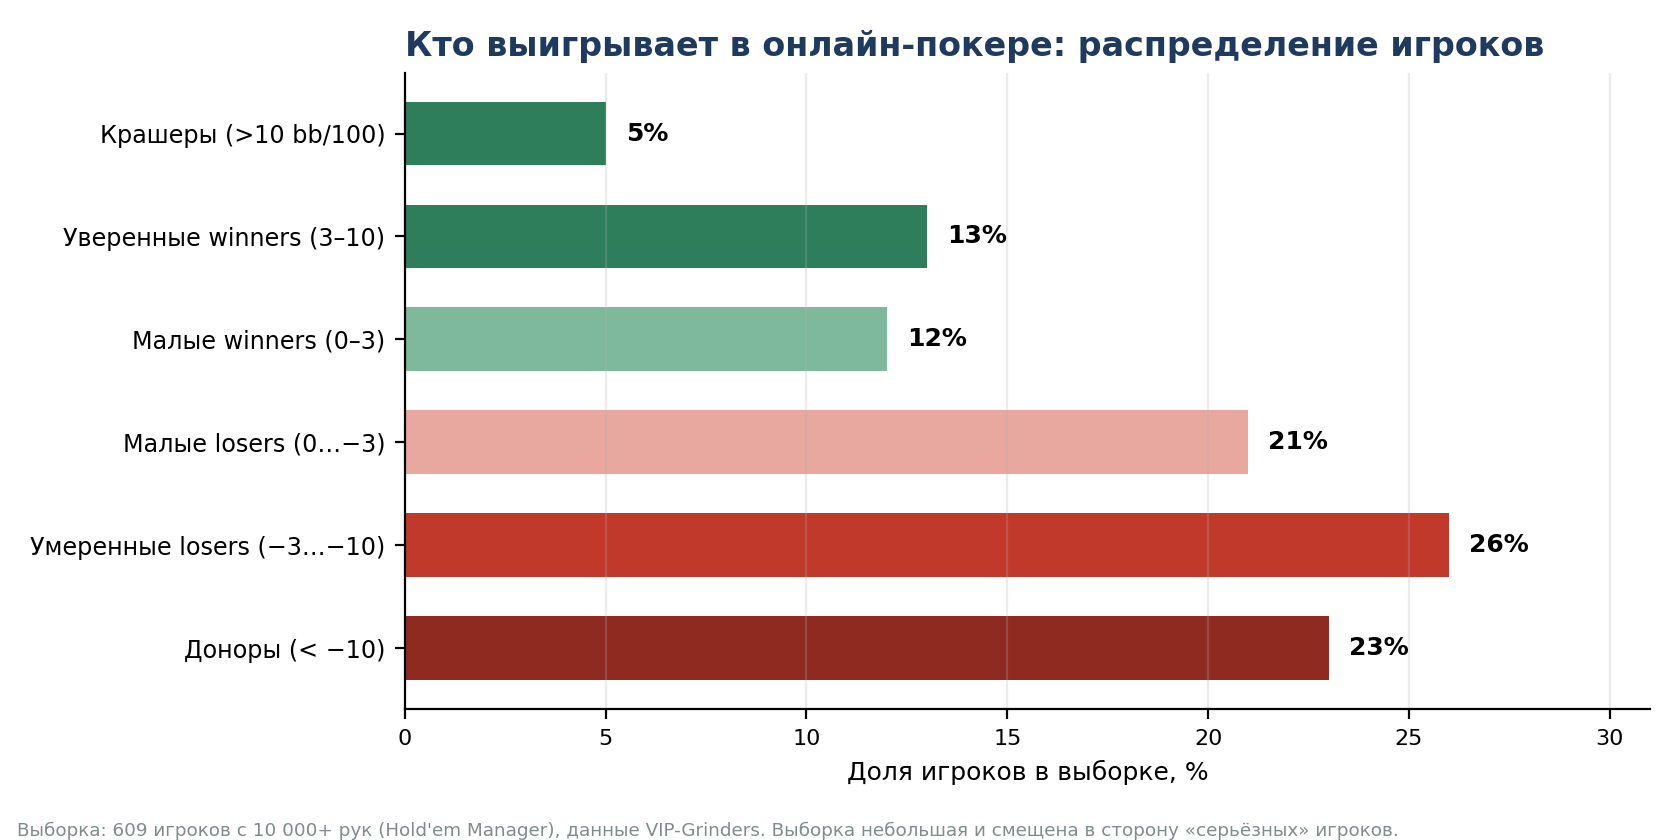
To demonstrate true profitability across contemporary games, empirical data from a sample of 609 active players with 10,000+ hand samples (compiled from Hold'em Manager and VIP-Grinders databases) illustrates winrate distribution:
Player Profitability Cohorts:
- Elite Crushers (>10 bb/100) — 5%: Top-tier theoretical minds who capture the outsized payouts associated with professional acclaim.
- Solid Winners (3–10 bb/100) — 13%: Well-studied regulars possessing disciplined game-selection and emotional composure.
- Marginal Winners (0–3 bb/100) — 12%: Technically winning players whose bottom-line compensation is heavily dependent on rakeback.
- Marginal Losers (0 to -3 bb/100) — 21%: Near-breakeven players whose profitability is dragged into the red by rake.
- Moderate Losers (-3 to -10 bb/100) — 26%: Regular recreationals exhibiting systemic positional, bet-sizing, and river calling leaks.
- Casual Donors (<-10 bb/100) — 23%: Pure recreational participants seeking entertainment and high-variance thrill.
Realistic Monthly Income by Discipline (50–80 Monthly Playing Hours):
| Format / Discipline | Realistic Monthly Net Range | Variance Exposure |
|---|---|---|
| Online NL Cash (Micro / Low Stakes) | $150 – $1,500 | Low to Moderate |
| Multi-Table Tournaments (MTT Online) | $100 – $2,500 | Very High (multi-month downswings common) |
| Spin & Go / Twister / Jackpots | $200 – $1,800 | Extreme (heavily jackpot-weighted) |
| Classic Sit & Go (SNG) | $150 – $800 | Moderate (format experiencing declining volume) |
| Live Cash ($1/$2 – $2/$5) | $400 – $2,500 | Low to Moderate (fields substantially softer than online) |
How Do Modern Grinders Survive?
- Staking Stables & Backing Collectives: Approximately 70% of mid-stakes tournament and cash regulars no longer fund their own action. They operate under contracts with staking stables. Stables absorb downswings, provide proprietary server capacity for heavy solver computing, and supply elite coaching in exchange for 40% to 60% of player profits. Poker has effectively transformed into structured corporate performance work with strict quotas.
- Aggressive Game Selection & Private Clubs: Engaging in "reg-wars" (battling other competent professionals) is mutually destructive due to rake. Pros have migrated en masse to private mobile club platforms (ClubGG, PokerBros, PPPoker), hunting recreational liquidity in private clubs across Latin America, the US, and Southeast Asia.
- Relentless Off-Table Solver Study: For every single hour spent playing live at the tables, dedicated pros dedicate 30 to 40 minutes of off-table analysis inside solver environments (PioSOLVER, GTO Wizard, Simple Postflop), memorizing equilibrium ranges and engineering micro-exploits against population tendencies.
5. The Artificial Intelligence Revolution: An Arms Race

By 2026, artificial intelligence has definitively divided poker history into pre- and post-solver epochs, impacting the game across four primary vectors:
5.1. Skill Equalization: The Erosion of the Baseline Edge
Between 2005 and 2015, acquiring nuanced theoretical poker comprehension required hundreds of thousands of hands, trial-and-error, and private forum discussions. Today, an $80 monthly web subscription to a neural-network solver enables a novice to master preflop and flop equilibrium frequencies within months. The edge that previously separated an elite pro from a serious student has narrowed dramatically.
5.2. Threat #1: Real-Time Assistance (RTA)
While early solvers required 10–15 minutes of compute time to solve complex postflop trees, modern cloud-based neural models compute GTO outputs in 0.2 seconds. Malicious actors deploy hybrid hardware setups: external video capture cards (HDMI splitters) pipe table video to secondary laptops that calculate exact bet sizings and relay instructions via covert earpieces or secondary monitors, entirely bypassing client-side desktop software scans.
A landmark case emerged when German regular Fedor Kruse utilized a multi-machine "Dream Machine" RTA setup to win approximately $90,000 at high stakes before his roommates leaked photographic proof of the setup to authorities.
5.3. Autonomous Next-Generation Bot Fleets
Early bot scripts were rigid rule-based programs vulnerable to exploitative lines. Modern bot operations integrate deep reinforcement learning and humanized timing randomization, operating silently across mid-stakes cash and MTT lobbies without triggering standard volume flags.
5.4. Operator Countermeasures: Biometrics and Machine Learning
Major operators have responded with military-grade security infrastructure. Industry leaders track mouse movement curves, micro-hesitations, cognitive load patterns, and click acceleration vectors. If an account consistently matches Nash equilibrium solver solutions above 97% across complex decision trees while exhibiting robotic timing, the account undergoes algorithmic quarantine and manual security review.
5.5. Structural Innovations: Solving Cheating Through Format Architecture
Operators are increasingly combating software cheating through structural innovation:
- Mystery Bounty & Progressive KO: Dynamic bounties introduce constantly shifting ICM calculations that static solvers struggle to compute dynamically.
- Fast-Fold Pools (Zoom / Rush & Cash): Random table seating after every folded hand prevents seat selection, predatory player tagging, and table-collusion rings.
- All-In or Fold / Flash Formats: Simplifying decisions to binary choices reduces the tactical advantage of solver usage while accelerating entertainment value.
6. Outlook: The Road to 2034
Despite significant growing pains, online poker is not dying; it is evolving into a more mature, technologically resilient industry. The forecast of $10.5 billion in market capitalization by 2034 reflects expanding digital adoption, but the underlying playing field will look profoundly different:
- The End of the Casual Solitary Grinder: The romantic ideal of the lone laptop traveler playing six tables from a beach café has been replaced by structured teams, institutional backing, and data analytics.
- Game Integrity as the Primary Selling Point: Operators will no longer compete primarily on deposit bonuses, but on certified bot-free ecosystems, hardware-level security guarantees, and immediate fair-play enforcement.
- The Live Poker Renaissance: Suspicion surrounding online game integrity has spurred unprecedented attendance at physical live events (WSOP, WPT, EPT, and regional tours), where players compete face-to-face in authentic human environments.
This analytical review is published strictly for educational and journalistic purposes and does not constitute an inducement to gamble. Real-money online poker involves substantial financial risk. Practice responsible gaming: never risk funds whose loss could negatively impact your personal well-being or financial security.
7. Methodology and References
Data compiled in this report incorporates publicly accessible statistical databases, tracking services, and industry research:
- Deuces Cracked: Global operator liquidity metrics (October 2026 report), PokerStars historical trends, and security audits.
- VIP-Grinders: "Is Online Poker Still Profitable in 2026?" industry whitepaper and 609-player empirical winrate dataset.
- PokerStake / PokerScout / GameIntel: Long-term cash game traffic logs from 2003 through 2026.
- PokerNews: RTA investigative reports, GTO Wizard Fair Play database checks, and WSOP 2026 tournament records.
- FiveThirtyEight & Casino.org: Historical post-Black Friday liquidity retrospectives and pandemic boom analyses.